blogger counters

Tuesday, August 24, 2010

Rolling Averages in Excel

In a previous post, I talked about how to add named ranges to an Excel report that will show, for example, the last two weeks of data from a TFS cube. Recently someone asked how we added the rolling average to a pivot table. In this post I’ll provide you with the information on how to do that.

First, if you open the Bug Trends Excel workbook that is part of the TFS 2010 dashboards and click on the pivot table, you’ll see that there is a rolling average value shown in the PivotTable Field List:

image

It turns out that Excel doesn’t have a way for you to manage calculated fields like this. Instead, you have to use a little bit of VBA code. You’ll need to do the following:

  • Open Excel’s VBA editor
  • Enter the code below
  • Place the cursor inside the code and press F5 to run the code
  • Delete the code

The final step of deleting the code is required because workbooks uploaded to Excel Services are not allowed to contain any VBA code. The code below will create the calculated measure and add it to the first pivot table in the workbook.

Sub AddCalculatedMeasureRollingAvg()
Dim pvt As PivotTable
Dim measureName As String
Dim measureFormula As String

Set pvt = Sheets(1).PivotTables(1)
measureName = "[Measures].[Rolling Average]"
measureFormula = "Avg([Date].[Date].CurrentMember.Lag(6): " + _
"[Date].[Date].CurrentMember,CoalesceEmpty([Measures].[State Change Count], 0))"


On Error Resume Next
Dim member As CalculatedMember
Set member = pvt.CalculatedMembers(measureName)
member.Delete
On Error GoTo 0

pvt.CalculatedMembers.Add Name:=measureName, Formula:=measureFormula, _
Type:=xlCalculatedMember
pvt.ViewCalculatedMembers = True
End Sub
Near the top of this code snippet is the definition of the rolling average, which uses a snippet of MDX code. There are two pieces of this that you might change:
  • Lag(6): You can change this number to change the length of the rolling average. The value of 6 gives you a 7-day rolling average (today back to six days before today).
  • State Change Count: Near the end of the string is the name of the measure that will be averaged. Here we’re averaging the number of times bugs changed state. You could change this to Work Item Count, for example, if you wanted to show a rolling average of the total number of bugs.

Friday, July 30, 2010

Customizing Report Parameters – SQL Reports

In a previous post I described how to customize the parameters in reports that ship with TFS 2010. That post, however, applies to most, but not all of the reports. Most of the reports use the cube, but some of the reports use the warehouse instead, which means two things:

  • The queries are written in SQL instead of MDX
  • The parameter values will be integer ID values instead of the long MDX names.

In this post I’ll describe how to get the values you need for areas and iterations in your team project so you can customize your reports.

First, here is an easy way to identify that a report uses the warehouse instead of the cube.

Determining if a report uses the warehouse

The instructions here are for SQL Server 2008. The process is slightly different if you’re using SQL Server 2008 R2.

  1. Open Report Manager (right click the Reports node in the Team Explorer in Visual Studio and click Show Report Site…)
  2. Navigate to and click your report
  3. Click the Properties tab
  4. Click the Parameters link

At this point you’ll see the list of parameters. The report will be a SQL report if you see a “*” for the default value of IterationParam or AreaParam, as shown here:

image

The single character “*” in the parameter means that it should not filter, which is displayed as All (No Filter) in the parameter bar.

Finding the Area/Iteration ID

Now that you’ve identified that a report uses the warehouse instead of the cube, you’ll need to find the ID value to use for the area/iteration. This will require some knowledge of the TSQL query language and a tool like SQL Server Management Studio (SSMS) that you can use to run queries.

  1. Open SSMS and connect to the SQL Server machine that hosts the warehouse
  2. Expand the Databases folder in Object Explorer and click Tfs_Warehouse (this is the default name, but your TFS administrator might have chosen a different name)
  3. Click the New Query button

You can then use the following query to find the iteration paths and their corresponding ID values for your team project (just substitute the name of your team project for ‘project name’ in the query):

SELECT IterationSK, IterationPath, ProjectPath, ProjectNodeName
FROM DimIteration a
INNER JOIN DimTeamProject tp
ON a.ProjectGUID = CAST(tp.ProjectNodeGUID AS NVARCHAR(256))
WHERE ProjectNodeName = 'project name'
ORDER BY IterationPath

This query will produce output that looks something like this:

image

Simply find your iteration path in the second column, and then use the value in the first column.

Note: I included the ProjectPath to handle the case where you have the same project name used in different Team Project Collections. When this happens, you’ll need to make sure you use areas/iterations from the project path that matches your project.

To find areas instead of iterations, simply change “Iteration” to “Area” wherever it appears in the query.

You can now copy this number into the parameter text box in Report Manager.

Wednesday, July 21, 2010

Colors in the Build Success over Time Report

The Build Success over Time report shows a color that depends on a number of things. Since you have to dig in and look at the source of the report to find out where all the colors come from, I thought I’d provide a high-level overview. The following table provides the rules that are applied in order. The first rule that matches controls the color:

Color Conditions
Light Red Build status is partially succeeded
Empty There were no builds
Red At least one build failed
Amber At least one test failed
Light Green At least one test passed, and the code coverage is below the threshold (explained below)
Dark Green At least one test passed and code coverage is above or equal to the threshold (explained below)
Yellow Builds had no errors, but there are no tests run in the build

Code Coverage Threshold

The code coverage threshold is controlled by a parameter in the report called CodeCoverageThreshold, which has a default value of 0.7 (70%). The following blog posts provide two ways to change this value:

Using TfsRedirect to Display Reports in TFS 2010 Dashboards

You may have seen some reports show up in the TFS 2010 dashboards and wondered how we did a few things:

  • How does the dashboard locate the report?
  • How did we hide the parameter bar?
  • How did we hide the report’s head and footer?
  • How did we make the reports smaller?

I’ll answer each of these questions in sections below.

What I won’t do here is provide a walkthrough of setting up web parts to show reports. My friend Chris Adams already wrote a nice blog on this: Enhancing TFS 2010 Dashboards – Project Mgmt, Bugs, Builds, etc.

What is TfsRedirect?

Here’s the scenario. You had TFS create a dashboard site in SharePoint when you created your team project (or you added it later as described here). There are several items on this dashboard that point to other locations that are potentially on other servers:

  • Team Web Access
  • Process Guidance
  • Reports shown on the dashboard pages

TFS itself know where to find these assets. And the locations can change if, for example, the TFS administrator moves the reports to a different server.

Rather than hard-code the locations of these assets into the dashboard, the TFS team created a web page called TfsRedirect.aspx that knows where these different assets are located, and will redirect to that page.

This is what the URL looks like on the Agile dashboard that shows the Burndown graph:

/sites/DefaultCollection/wss/_layouts/TfsRedirect.aspx?tf:Type=Report&tf:ReportName=Dashboards/Burndown&tf:ShowToolbar=0&Width=381pt&Height=180pt

Yikes, you say! It’s actually not that bad once you break this into the different parts. The first part is basically the path to the TfsRedirect.aspx file. This is a relative path that is used to get to various pages on your site, followed by “_layouts/TfsRedirect.aspx” that refers to the actual location of this file.

After the question mark are a set of parameters. The parameters that begin with tf: are parameters to TfsRedirect itself. All other parameters will be passed on unchanged to the final URL that TfsRedirect builds, which in this case will be a URL to the report on Reporting Services.

TfsRedirect Parameters

The first parameter, tf:Type, determines the destination for the redirection, such as reports or process guidance. Here are the values support for tf:Type, which is a required parameter:

tf:Type Value Meaning
Report Displays a single report. See below for additional parameters.
ReportList Displays a list of reports, using SQL Reporting Services’ Report Manager page. This values is used by the Reports quick launch link on the dashboards to take you to Report Manager.
ProcessGuidance Display the process guidance defined for this team project. This is used by the Process Guidance quick launch link in the dashboards.
WebAccess Redirect to the Team Web Access web application. This is used by the Team Web Access link on the dashboards.

There are some other parameters that can be used in unusual cases:

Parameter Meaning
tf:ClearCache=1 (optional) You should never include this parameter in a web part. Instead, this is a parameter that a TFS administrator might after changing TFS settings, such as the location of reporting services, in order to have the web site retrieve the latest value right away.
tf:Test=1 (optional) You can add this parameter onto an existing TfsRedirect URL to display “debugging” information that can help a TFS administrator. This will display information such as the connected team project. It will also display the URL that TfsRedirect will use as the destination of the redirect.
tf:ProjectID (optional) Allows you to specify a team project that is different from the team project connected to the dashboard. This is the project’s GUID, and looks something like this:

     ProjectId={74893-374983-73489-473894237}

tf:Type=Report Parameters

Most of the extra parameters supported by TfsRedirect are used for the Report redirection type. Here are the parameters supported:

Parameter Meaning
tf:ReportName (required) The name of the report. If the report is inside a folder, you’ll need to put that folder in front of the name. For example, “Dashboards/Burndown.” In some cases you’ll see “%2f” substituted for the “/” character, but you don’t need to do this when calling TfsRedirect.
tf:ShowToolbar (optional) Set to 0 if you want to hide the report parameters bar and the toolbar. Setting this to 1, or leaving it out, will show both. The Agile and CMMI dashboards always set this to 0 for reports shown on the dashboard.

tf:Type=ProcessGuidance Parameters

There is only one optional parameter for process guidance:

Parameter Meaning
DocumentPath (optional) A file name or relative path that will be appended to the normal guidance URL. If you have problems getting this to work, you can use the tf:Test=1 parameter described above to see the full URL that TfsRedirect builds.

Reports that Support IsDashboard

We did some extra work to make some of the reports work on dashboards. This was done by adding some parameters to the report (you can set

OK, the final two questions are about how to display “dashboard” versions of the reports. We added “dashboard” support to some, but not all of the reports. Basically, if the dashboard has a parameter called IsDashboard, it has some support. Here are the parameters related to dashboard support:

Parameter Meaning
IsDashboard Set this to True to hide the header and footer of the report. For example, IsDashboard=true. In some cases, we have special dashboard versions of the report that don’t need this parameter, located in the Dashboards report folder.
Width If present, you can use this to set the width of a chart. For example, Width=381pt. The measure is important here, and Reporting services can be a little picky. Points (pt) are usually a good measure to use.
Height If present, sets the height of the chart in the report. The same rules apply as for Width.

Here are some of my previous blog posts that will help you with setting report parameters:

Tuesday, July 13, 2010

New Whitepapers for Team Foundation Server 2010 Reports

Several years ago I wrote a whitepaper called Creating and Customizing TFS Reports that covered reports in Team Foundation Server 2008.

I’ve updated this whitepaper, and split it in two, for the new Team Foundation Server 2010. You can find them here:

Wednesday, June 30, 2010

Reporting Services, Web Service Data Source, and Parameters

I wasted an entire day trying to figure out why I couldn’t call a web service that takes parameters. The problem turned out to be very simple to fix, but not at all obvious. I found some documentation on MSDN: Defining Report Datasets for XML Data, and also Reporting Services: Using XML and Web Service Data Sources. Both of these use examples that use the Reporting Services web services. But I couldn’t get it to work with my web service that I created with Visual Studio 2008.

Calling the Web Method

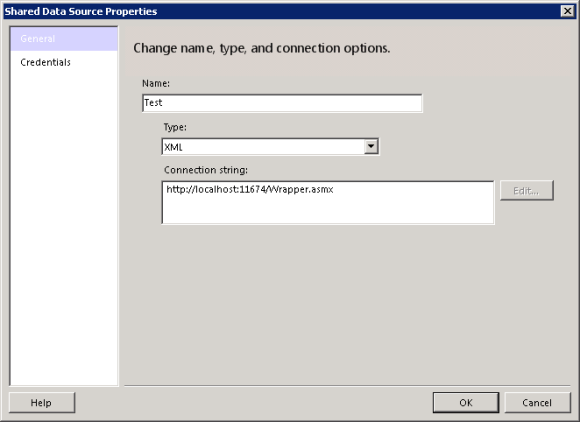
Here is how I set things up (the test web method is called GetData and takes a single string parameter). First, define the data source:

  • Select XML in the Type field
  • Enter the URL to the ASMX file in the Connection string field:

 XML Data Source

  • Click Credentials and set it to Windows Authentication (that’s what I wanted, at least)
  • Click OK

This will give you a data source that knows how to connect to the web service. Next you need to add a data set that calls a single web method, and this is where things went wrong.

  • Create a new data set that uses the data source defined above
  • Click the Query Designer… button
  • Paste XML that defines what method to call, and what parameter values to use:

<Query>
    <Method Name="GetData" Namespace="http://tempuri.org/">
        <Parameters>
            <Parameter Name="value">
                <DefaultValue>test</DefaultValue>
            </Parameter>
        </Parameters>
    </Method>
    <SoapAction>http://tempuri.org/GetData</SoapAction>
    <ElementPath IgnoreNamespaces="true">*</ElementPath>
</Query>

I’ve highlighted in bold and red the two changes I had to make over what I found in the documentation. By default, a new web services uses the namespace “http://tempuri.org/” that includes a trailing slash. So you have to add this in the Namespace attribute of the Method element. But when you do this, you get an extra slash in the default action: http://tempuri.org//GetData. To get around that, you have to explicitly provide the soap action using the SoapAction attribute.

Once you have this defined, you can click on the ! button to call your web method. The * in ElementPath tells Reporting Services to look for the element it finds that repeats to define the rows, and the next-level children as the column values.

Parameters

Now about the parameters. You define the set of parameters using Parameter elements inside a Parameters element, as shown above. The DefaultValue element provides the value to use when it’s not provided. This will be the value that RS uses when you click the ! button to run the “query” in the Query Designer window.

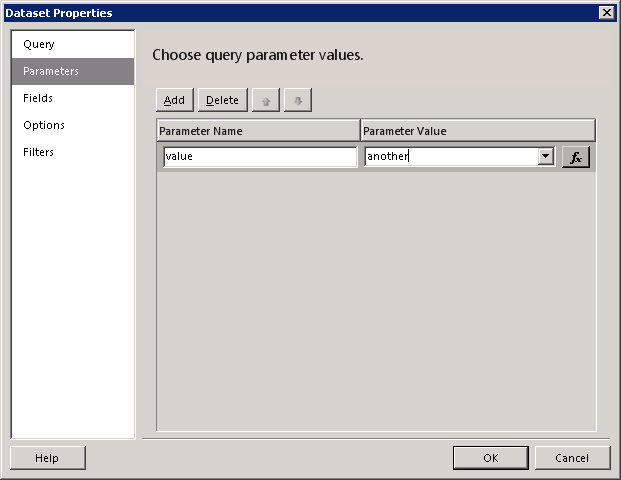
The default value will also be used if you haven’t defined a query parameter with the same name as the parameter value. For example, if the parameter for you web service is called “value,” you could define the parameter like this:

DatasetParameters

The report will now use this value, instead of the default value specified in the “query” XML, when you run the report.

Monday, May 10, 2010

Sliding Date Ranges with Excel 2010 Pivot Tables

Using an Excel PivotTable to retrieve and graph data from the TFS cube is really easy. And it’s pretty easy to setup date filters for specific date ranges. But what if you want the date range to be a sliding range, such as the past 4 weeks? The answer is with a named set.

If you’re using Excel 2010, there is now a dialog box that allows you to create named sets. Describing a date range that is from today going back N weeks requires a little snippet of MDX (Multi-Dimensional eXpression language). I’ll present the snippet that you need and I’ll explain how to change the number of weeks, days, etc.

Create a Named Set

Here is how to create a named date range set:

  1. Select a cell inside a pivot table bound to the cube so that the PivotTable tools are available
  2. Click the Options tab on the ribbon under the PivotTable Tools section:
    image
  3. Click the Fields, Items & Sets drop-down in the Calculations section of this ribbon tab
  4. Click Manage Sets… in the drop-down
  5. Click New… and then Create Set using MDX…
    image
  6. Enter a name for this set in the Set name text box
  7. Enter the MDX expression that defines the date range (see below)
  8. Click OK

Using a Named Set

Once you’ve defined a named set, it will appear in the PivotTable field list. Where it appears will depend on how you’ve defined in the named set. The sets we’ll define in the next section are all based on the Date dimension, so they’ll appear under that dimension, something like this:

image

You can now use this named set wherever you would use any of the Date dimension’s attributes.

Defining the Named Set

Here is where we get into the actual MDX used to define the named set (that you would enter in step 7 above).

Last 30 Days

For the first example, we’ll create a named set that returns all of the days during the last 30 days. Here is the MDX:

Filter(
    [Date].[Date].[Date],
    [Date].[Date].CurrentMember.Member_Value < Now()
    AND [Date].[Date].CurrentMember.Member_Value >= DateAdd("d", -30, VBA![Date]())
)

Yikes, you say? Well, you can use this without understanding most of what’s inside. The two important pieces are inside the DateAdd function: “d” and –30. The “d” says that we want to add days, and –30 says to go back 30 days. So it includes the last 30 days, plus today (for a total of 31 days).

Last 4 Weeks

Now let’s say that instead of every day, you just want to see the week ending summary. Here is the expression you can use in that case:

Filter(
    [Date].[Year - Week - Date Hierarchy].[Week],
    [Date].[Year - Week - Date Hierarchy].CurrentMember.Member_Value < Now()
    AND [Date].[Year - Week - Date Hierarchy].CurrentMember.Member_Value >=
        DateAdd("ww", -4, VBA![Date]())
)

Here we’ve changed the interval to week (ww) so we get the last four weeks.

Monday, April 19, 2010

Report Parameters in Dashboards via URL Parameters

I had a recent question about how to customize the Burndown and Burnrate report to show both tasks and bugs. By default this report only shows tasks. Unfortunately, it’s not very easy to customize the report to change the default from task to both task and bug.

However, you can create a URL to the report that will set the default to both work item types. Here’s how. Let’s say you have a URL to your report that looks something like this:

http://server/ReportServer/Pages/ReportViewer.aspx?%2fTfsReports%2fDefaultCollection%2fAgile%2fProject+Management%2fBurndown+and+Burn+Rate

The following rewrite of this URL will display the same report, but with both Task and Bug selected by default:

http://server/ReportServer/Pages/ReportViewer.aspx?%2fTfsReports%2fDefaultCollection%2fAgile%2fProject+Management%2fBurndown+and+Burn+Rate&WorkItemTypeParam=[Work Item].[System_WorkItemType].%26[Bug]&WorkItemTypeParam=[Work Item].[System_WorkItemType].%26[Task]

The parameter that controls the work items is called WorkItemTypeParam, and it expects values that are from the cube (see my post on Customizing Report Parameters for how to get the actual value to use). When you want to supply more than one value, as here, you need to repeat the parameter assignment once for each parameter value. I’ve highlighted the two instances of the parameter assignment above.

Note: You need to have the %26 in front of each work item type in order for this to work. Reporting Services is very picky—the value you send to a parameter has to match the parameter values exactly. The Burndown and Burnrate report has & characters (%26 when encoded) in front of [Bug], etc., which means that these are key values.